IPVM Integrator Survey Methodology and Demographics
IPVM has completed its first ever Integrator Survey, providing an unprecedented and in depth examination of what integrators like, dislike, and choose in the market. During November 2011, the results will be revealed in a series of reports. This note explains the methodology used and the demographics of the integrators in the survey.
The Survey
We prepared a 25 question survey based on input from our integrator members. The goal was to provide a mix of questions focusing on products and technology but not financial information. Questions covered VMS, IP cameras, video analytics, PSIM, VSaaS, and servers, as well as technical issues (lens selection, recording mode, frame rate, etc.). To see for yourself, read the 25 question survey form.
The survey consisted of a mixture of multiple choice and open ended questions. Any question asking for preference on manufacturer was open ended so that the integrator was not constrained by predefined options. Equally important, the majority of questions included comments sections where the integrator was asked to elaborate and explain their selection. This was critical to us because we wanted to understand not only what the integrator preferred but why they came to that conclusion.
The Participants
A total of 80+ integrators took the survey. Integrators were solicited from the IPVideoMarket website, the IPVideoMarket weekly newsletter and the IPVideoMarket twitter account.
Integrators were paid $20 each for completing the survey. We felt it was important that integrators receive some tangible form of compensation to encourage them to report truthfully and completely.
Participants Location
The 80+ participants came from 19 different countries. The United States was the most represented with 65% of the total respondents. Nonetheless, another 30 respondents from 18 other countries responded. The table below provides a graphical overview:

Certainly, one of the biggest limitations was that the survey was only in English, which we believe is a big reason why so few Continential European integrators participated.
Relative to our overall traffic levels, the US was far over-represented. The US represents only 40% of our website traffic but 65% of the survey respondents.
Characteristics of Participants
We asked a few demographic questions to better understand what the integrators do and who they serve.
The integrators represent a broad range of average deployment sizes from small scale to large systems. The results below shows the range:

The typical integrator in this survey is likely commercial and industrial focused and is bigger than traditional studies we have seen that are more focused on the burglar and residential markets.
That noted, given the range of respondents, we were able to filter responses based on average number of cameras deployed to better understand how integrators differed in their preferences (e.g., are integrators with higher average camera counts more likely to prefer Genetec or Milestone? Are integrators with lower camera counts less or more likely to choose megapixel cameras or auto back focus?).
Additionally, we asked the integrators whether they are deploying more analog or IP cameras. Here is the results to that:
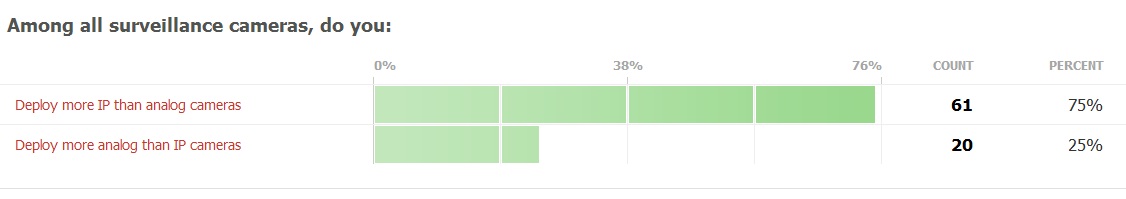
Not surprisingly, the clear majority are now deploying more IP than analog cameras. That noted, it was obviously not universal with a solid quarter representing the more traditional way. This gives us a nice mix of opinions and perspectives.
Participant's Identities
None of the participant's identities will ever be revealed. This is to protect them and to ensure that they can speak freely and openly to us. The survey responses included an amazing number of frank and detailed criticism of manufacturers and technology issues. We will quote them anonymously to help educate the industry of common issues. However, we will always protect their identities so that no retribution against them occurs.
Representative but not Scientific
We think the results are quite representative of common experiences of English speaking integrators. That said, while we have focused on making this is a fair and informative program, we do not claim that the survey is scientific or absolute. We do believe that it captures many common problems and are excited to be able to share that with the community to better highlight issues and campaign for better solutions.
Releases
Here are the result reports released to date: