Video Surveillance Statistics Directory Vol 2
In this report, we aggregate and present numerous statistics about how surveillance is being used in the real world. Recently, we conducted an in depth survey of 100 integrators around the world, asking them a variety of detailed questions.
We learned a lot and our PRO members had very positive feedback to the program. Next month, we are starting a third series asking a new round of questions. Before we go there, this report catches up on the questions and statistics we have generated in the last few months.
Let's start with an interesting statistic:
Megapixel Usage
The market is moving to megapixel but how much megapixel is being used compared to SD? We asked 100 integrators, of all the IP cameras that they recently deployed, what percentage of them were megapixel. The histogram below breaks down their answers:
Two interesting elements stand out:
- The 'u' shape of the curve: Integrators are divided on megapixel use, with most either using all megapixel or hardly none at all. This is the opposite of a 'normal' curve one might expect where there is a consensus of a 'right' amount in the middle.
- Majority Megapixel: Despite the abnormal curve, the average integrator in the survey deploys megapixel for more than 60% of their overall IP cameras, showing how mainstream megapixel has now become.
For more details on this topic, see our SD vs Megapixel statistics review.
Statistics
The following statistics are aggregated in this directory:
- Video surveillance / access control integration
- Using switches vs midspans for PoE power
- Favorite hard drive manufacturers for surveillance
- Favorite network switches for surveillance
- Surveillance subcontractor user
- Mobile app usage in surveillance
- Favorite surveillance storage manufacturers
- Favorite surveillance storage type
- Wireless usage in surveillance
- Hard drive failure statistics
- UPS deployment statistics
- PTZ usage statistics
- RAID / storage redundancy statistics
- RFP Quality statistics
- End User Complaint rankings
The chart below shows overall integrator usage:

As the chart demonstrates, video / access integration is overall quite rare in the industry. The results indicate that only 10 - 15% of all systems are integrated.
However, the more cameras a deployment has the more likely they are to integrate video and access. The chart below shows a great disparity in integrators who rarely integrate these systems:

Read the full report on video surveillance / access control integration.
PoE: Switch vs Midspan
Here is a visual breakdown of PoE preferences:

An overwhelming majority of respondents (86%) preferred PoE switches to midspans. This is not surprising, as past discussions have indicated preferences for PoE switches, as well.
Read the full note on using switches vs midspans for PoE power.
Favorite Hard Drive Manufacturers
Here is a visual breakdown of the top choices for hard drives:

Read the full note on favorite hard drive manufacturers for surveillance.
Favorite Network Switches for Surveillance
Here is a visual breakdown of the top choices:

Read the full note on favorite network switches for surveillance.
Subcontractor User
Across all integrators, subcontractor usage was mixed. Overall, a slight majority of integrators used subcontractors infrequently.

However, integrators specializing in small jobs overwhelmingly (more than 2/3rds) infrequently used subcontractors. The results were the opposite for integrators specializing in large projects with more than 2/3rds regularly using subcontractors.

Read the full note on surveillance subcontractor user.
Mobile App Usage in Surveillance
The following chart shows overall mobile app usage:

Larger camera count systems are far less likely to use mobile apps than smaller ones. The trend is pronounced. See here:

Read the full note on mobile app usage in surveillance.
Favorite Surveillance Storage Manufacturers
In the most fragmented results so far, integrators answered with 35 unique responses to their favorite provider of storage for surveillance (contrast this with results from questions such as favorite camera or VMS, where leaders had much stronger showings.). These results varied from use of on-board storage provided by DVRs and NVRs, through NAS options, to large SAN systems. However, a few responses stood out.

Read the full report on favorite surveillance storage manufacturers.
Favorite Surveillance Storage Type
Here is the breakdown of the results:

Read the full report on favorite surveillance storage type.
Wireless Usage
The histogram below provides a visual overview of how integrator's wireless usage varied:
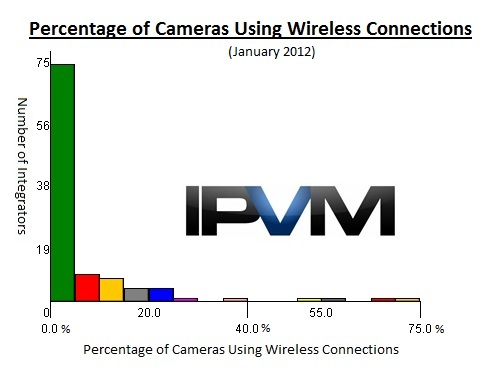
As the 'L' shape indicates, overwhelmingly, integrators use almost no wireless. About 20% of them use wireless between 5% and 25%, signaling that more advanced integrators use wireless as a niche option. The smaller bars on the right hand side indicate that a small number of integrators are wireless surveillance specilists.
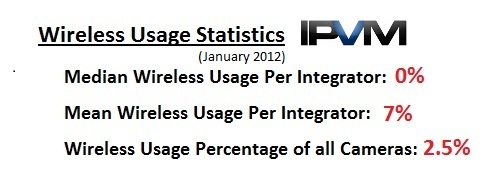
Next, let's look at a number of key wireless metrics:
Read the full note on wireless usage in surveillance.
Hard Drive Failure Statistics
Here is a breakdown of integrator's experience with hard drive duration:

Read the full note on hard drive failure statistics.
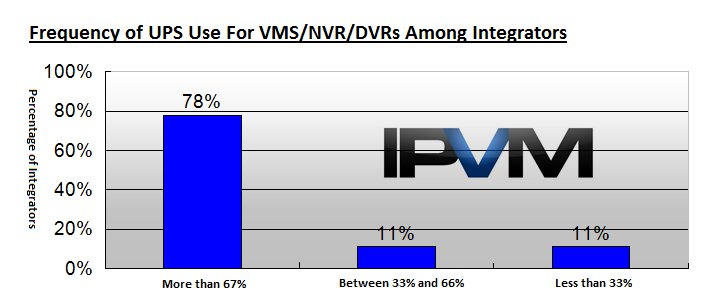
UPS Deployment Statistics
The table shows the responses:
Read the full note on UPS deployment statistics.
PTZ Usage Statistics
To start, let's look at a histogram below which breaks down results by the frequency of integrator responses - the taller the bar, the more integrators who deploy that percentage of PTZ cameras.

The graph has an overall "L" shape showing that most integrators deploy a quite small percentage of PTZ cameras. However, the bumps near 25%, 50% and 75% show that a small number of integrators deploy heavy amounts of PTZs.
Now, let's take a look at 3 metrics for understanding PTZ adoption:

Read the full note on PTZ usage statistics.
RAID / Storage Redundancy Statistics
The table belows shows RAID usage in video surveillance:
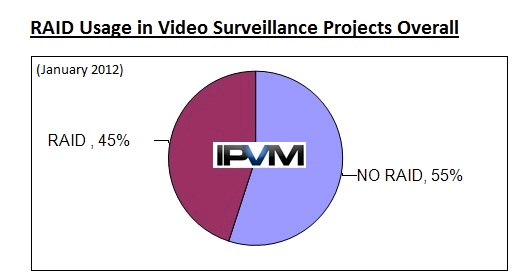
Here we break down usage by integrator. As the table shows, integrators were fairly evenly split in how often they used RAID:

Read the full note on RAID / storage redundancy statistics.